
Power BI offers many options for exporting and sharing data, but sometimes users run into small, yet frustrating limitations. One such limitation is the export format of CSV files. By default, Power BI exports CSV files with a comma (,) as the delimiter. However, in many regions – especially across Europe – the standard delimiter is a semicolon (;).
Unfortunately, Power BI does not provide an out-of-the-box option to change the delimiter. This can cause challenges when opening CSV files in Excel, as the data may not split correctly into columns.
The good news is: with Power Automate, you can easily solve this problem! In this guide, I’ll show you how to build a simple automated flow that exports your Power BI data with semicolons instead of commas.
What is Power Automate?
Power Automate (previously known as Microsoft Flow) is a cloud-based automation service that allows you to connect different apps and services. You can use it to:
- Automate repetitive tasks (like sending emails or notifications)
- Move data between apps and services (like exporting from Power BI to OneDrive)
- Create scheduled processes (like refreshing and distributing reports)
In our case, we’ll use Power Automate to convert a standard Power BI CSV export into a semicolon-delimited file -automatically, with no manual intervention.
Licensing Requirements
To use this solution, you’ll need:
- Power BI Pro (or Premium per user, depending on license you use in Power BI Service) – because you’ll be connecting to your semantic model in Power BI Service via Power Automate.
- Power Automate license – most Microsoft 365 business plans include Power Automate in the package. If you already use Office 365 at work, you likely already have access.
✅ In most cases, if you already have Power BI Pro in your tenant, you’ll be able to follow along without additional purchases.
Prerequisites
Before starting, make sure you have the following:
- Power BI semantic model published to the Power BI Service, with data you want to export.
- Access to Power Automate in your Microsoft 365 environment.
- OneDrive or SharePoint Online (or another storage service) where your exported CSV files will be saved.
- Basic familiarity with Power Automate (don’t worry, I’ll walk you through everything step by step).
And now, let’s do it!
Here is summary of steps:
- 1. Create the flow (Scheduled)
- 2. Get the DAX Query Using Performance Analyzer
- 3. Power Automate – Run a query against a dataset (Power BI)
- 4. Parse JSON (rows). Convert the raw Power BI query results into a structured format that Power Automate can understand
- 5. Select — rename & order columns. Pick only the columns you need, rename them if necessary, and order them correctly
- 6. Initialize variable — CSV header line
- 7. Apply to each — build each CSV row
- 8. Compose Row. Format the current row as proper CSV text.
- 9. Append to array variable. Collect all the formatted rows together in a list.
- 10. Compose – join all lines with newlines for each row
- 11. Create the CSV file (OneDrive)
Step by step!
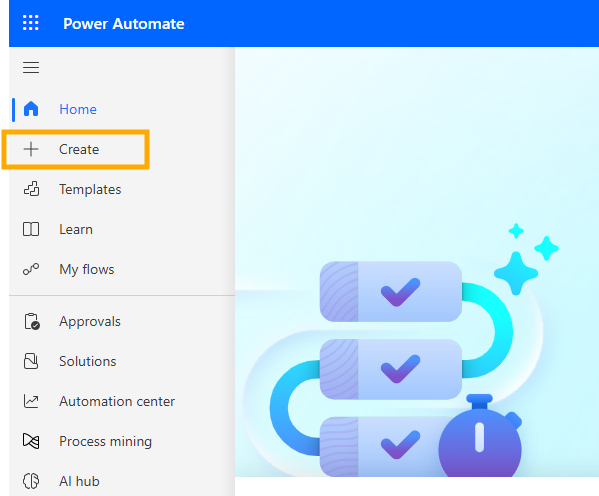
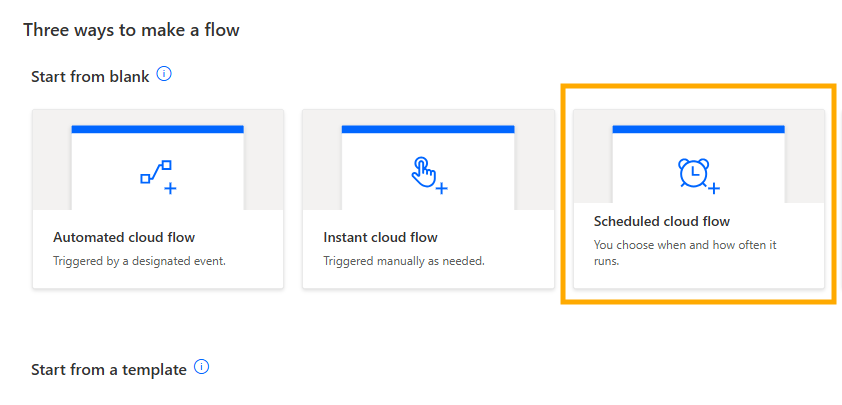
1. Create the flow (Scheduled)
- Power Automate → Create → Scheduled cloud flow
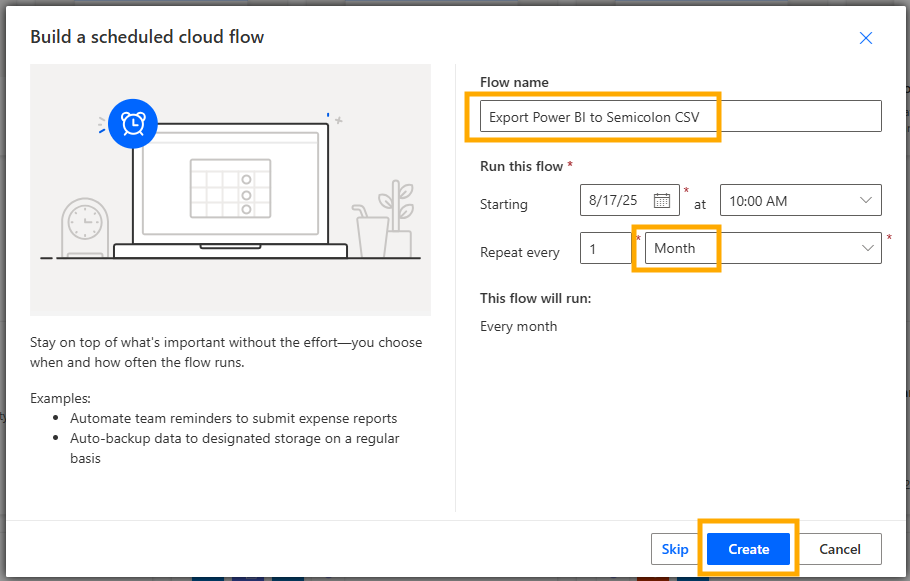
- Name of the flow:
Export Power BI to Semicolon CSV - Recurrence: set as you like (e.g., Monthly, every 1 month – this can easily be changed)
- Create
Screenshots:
2. Get the DAX Query Using Performance Analyzer
Before you can run a query against a dataset in Power Automate, you first need to extract the query from Power BI. This is done using the Performance Analyzer tool inside Power BI Desktop.
How to open Performance Analyzer:
- Open your pbix report in Power BI Desktop (report or dataset, no matter – the goal is just to create a visual which will contain all the fields you need for export).
- Go to the View tab in the ribbon.
- Enable Performance Analyzer. A pane will appear on the right side.
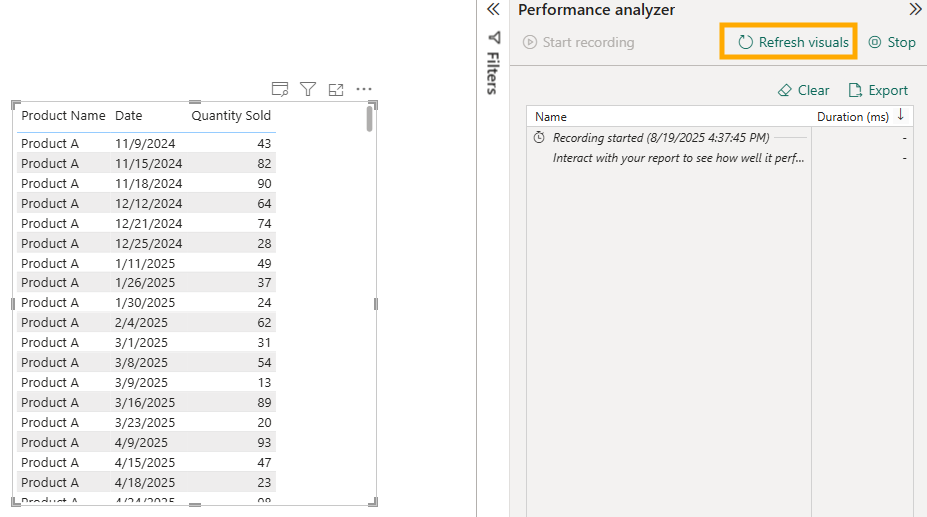
Recording a query:
- Click Start Recording in the Performance Analyzer pane.
- Click on “Refresh Visuals”.
- Once the visual is refreshed, expand that visual within performance analyzer pane (click on “+”) and then click the Copy Query button.

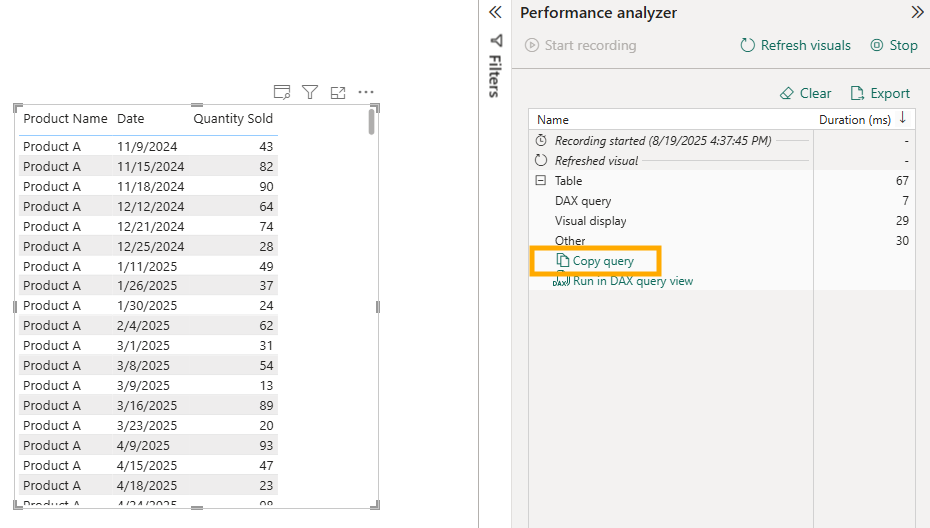
This will copy the DAX query that Power BI generated in the background. You can paste it into Notepad (or any text editor) for later use.
Things to pay attention to when copying queries:
Fields order – The sequence of columns in your Power BI visual will directly affect the dataset you get back.
Sorting – The order of the fields in your visual determines the order in the query results. If your automation depends on sorted output, make sure the order is correct before copying.
Totals and subtotals – Performance Analyzer will also capture queries for totals. Decide if you need raw detail rows or aggregated totals.
3. Power Automate – Run a query against a dataset (Power BI)
Back to Power Automate. All next steps are done within Power Automate.
Add action (click on “+” sign), and then in search bar type “run a query against a dataset” and then select that option: Power BI → Run a query against a dataset

Firstly you will be asked to authenticate yourself, just use credentials that you use to login to your Power BI Service account. This will enable Power Automate to communicate with Power BI Service.
Fill in parameters:
Workspace: workspace where semantic model (dataset) is published
Dataset: dataset which contains data for export
DAX Query: paste your query as is (query that you copied from Performance Analyzer)

4. Parse JSON (rows)
Add action: Data Operations → Parse JSON

- Content (expression): when you click on content, there will be a little pop-up showing two icons on the right.
Click on the one below, “Fx” icon.
Now, on the right side there will appear blank space to paste formula below and then click on Add button:
body('Run_a_query_against_a_dataset')?['results'][0]['tables'][0]['rows']

Schema (use script below as a template; adjust table/column names according to table and columns that you want to export):
{ "type": "array", "items": { "type": "object", "properties": { "Product[Product Name]": { "type": "string" }, "Fact[Date]": { "type": "date" }, "Fact[Quantity Sold]": { "type": "number" } } }}
- JSON schema allows these data types:
"string""number""integer""boolean""array""object"
So, if there is a field Date, mark it as string, not as a date within this schema part.

It is time to see if everything is fine, let’s test what we have done until now.
Go to Save and then Test.

If there is an error shown on the top after clicking Save button, check the error, see if the error is relevant to step “Run a query against a dataset” or “Parse JSON”.
Probably the issue would be Parse JSON if your layout is a lot different or field type is wrong.
In that case, you can just paste to ChatGPT DAX query generated via Performance Analyzer and ask to convert it to JSON schema for Power Automate.
Testing Power Automate Flow
- After clicking on Test button, choose option “Manually” because we want to trigger the flow now and click on “Test” button
- In the next step it will notify you that this flow is connecting to Power BI Service and if needed, you can review connection details (credentials) by clicking on Review connections and actions. Click on button “Run flow”
- Next step, i am not sure why it is there, you just need to click on button “Done” :)
- After these steps you will be shown all actions of your flow, on each action there are two labels/icons.
If everything is fine there will green checkmark icon and besides duration of each step (in seconds).
If it failed, there will be red X icon. Copy the error and if needed consult with ChatGPT what you should fix.

- On the left side there are two sections, specific for each action:
INPUTS – each action has parameters used in the action
OUTPUTS – each action has output, the result – here it shows values of the first row
Clicking on “Show raw inputs” or “Show raw outputs”, you can actually see the list of all rows (in our cases, rows to be exported).

To get back to editing the flow, on the top right part of Power Automate, just click on button “Edit” and it will open again Edit mode.
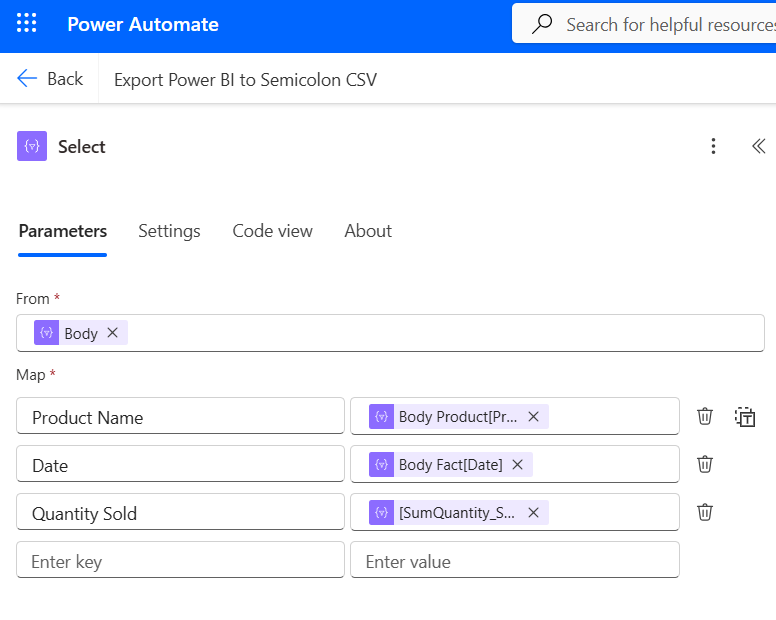
5. Select — rename & order columns
Add action: Data Operations → Select

- From: click on “From” area and it will show you again two icons as in previous step.
This type, chose the first icon (⚡which represents Dynamic content – output of some of previous steps).

Here, select “Body” which is under “Parse JSON” action:
It means that in current action (Select), we are using the result of previous step (Parse JSON).

Under Map area:
Enter key: here enter the name of the column that you want to appear in the final export. Just type the text.
Enter value: when you click on it, choose “Fx” option, and for each item add formula mapping and then click on “Add” button:
Product Name → item()?['Product[Product Name]']
Date → item()?['Fact[Date]']
Quantity Sold → item()?['[SumQuantity_Sold]']
Why doesn’t Quantity Sold use same logic, example: @item()?['Fact[SumQuantity_Sold]']
I tried and when tested the flow at this step, this column returned null for each row.
Then i checked that output of previous step (Parse JSON) and saw in OUTPUT area that Power Automate didn’t add table prefix for this column.
I didn’t go to much in details, is it because it is aggregated numeric column (not a measure) or something else. But pay attention to this step.
Map columns exactly as they appear in Parse JSON output.
Once you enter mapping formulas, they will appear like this:
This is important step so save and test the flow to see if it is returning correct columns and values.
What have we done so far?
1. Connected Power Automate to Power BI Service and generated data from semantic model via DAX query
2. Converted the result into readable JSON format
3. Defined headers and mapped them to actual data that is coming from Power BI
6. Initialize variable — CSV header line
Add action: Initialize variable.

- Name:
csvLines - Type: Array
- Value: [“Product Name;Date;Quantity Sold”]

7. Apply to each — build each CSV row
Add action: Apply to each

- Items: choose output of Select. To find it, click the first icon (⚡which represents Dynamic content – output of some of previous steps).

8. Compose Row
Add action: Compose.
Important note: this step is within “Apply to each” part.

Click on inputs, click on "Fx" button. Past script below and click on "Add" button.concat( '"', replace(string(item()?['Product Name']), '"','""'), '";', '"', replace(string(item()?['Date']), '"','""'), '";', '"', replace(string(item()?['Quantity Sold']), '"','""'), '"')

9. Append to array variable
Add action: Append to array variable.
Important note: this step is within “Apply to each” part.

- Name:
csvLines - Value: Compose > Outputs

10. Compose – join all lines with newlines for each row
Add action: Compose (name: Compose_CSV_Text).
Important note: this step is outside of “Apply to each” part.

Click on Inputs and then choose "Fx" button.Paster formula below and click on "Add" button.join(variables('csvLines'), decodeUriComponent('%0A'))

decodeUriComponent(‘%0A’) creates new line for each row in data.
Ok, that is it regarding data preparation.
Now, we can choose where to export data.
Power Automate offers different options:
1. create file on local pc
2. create file on OneDrive
3. create file on Sharepoint…
In my scenario, i will use OneDrive.
11. Create the CSV file (OneDrive)
Add action: OneDrive for Business → Create file (or SharePoint → Create file)

- Folder Path:
/Documents(or your folder) - File Name (static): export_semicolon_final.csv
- File Content: use dynamic content (⚡) and select Compose > Outputs.

That’s it!
Save the flow and run it.
If everything is fine, you will have green checkmarks for each step.
If not, check the error under step which shows the error.

Finally, let’s go to OneDrive to see if the file has been created.
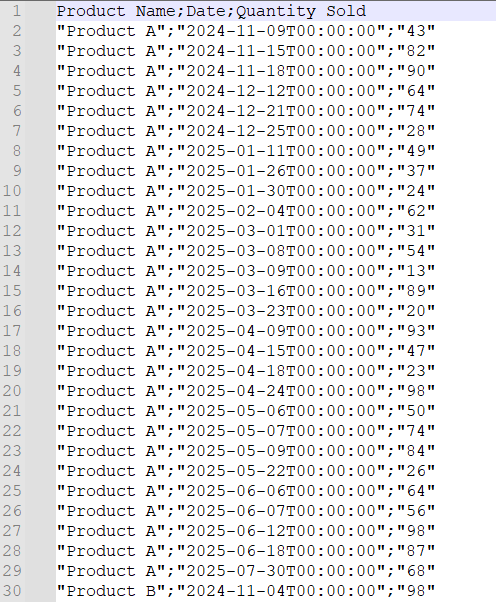
If yes, download it and open in Notepad to see if it looks correct.

Here is the export layout in notepad.
If you open it in Excel, you will be able to split data to columns using “;” delimiter.
Home this post will help you solve issues with exporting data from Power BI using semicolon delimiter.
Again to mention, Power Automate is here to automate the work.
If i set it to run each day, export file will be updated every day.
Enjoy!
