I love Excel.
I worked full-time in Excel for almost 5 years. And it was great.
There were so many amazing reports, CRAZY formulas and VBA automations I am proud of.
Excel is actually amazing.
But here’s what I’ve seen again and again in real growing companies: Excel doesn’t break overnight.
It quietly becomes a bottleneck.
If you’re a CEO or a manager and something feels “off” with Excel reporting lately, this will probably sound very familiar.
1. “Which Excel File Are We Using Today?”
This is usually the first warning sign.
In almost every company I’ve worked with, there’s a moment when someone asks in a meeting:
“Wait… are we all looking at the same Excel file?“
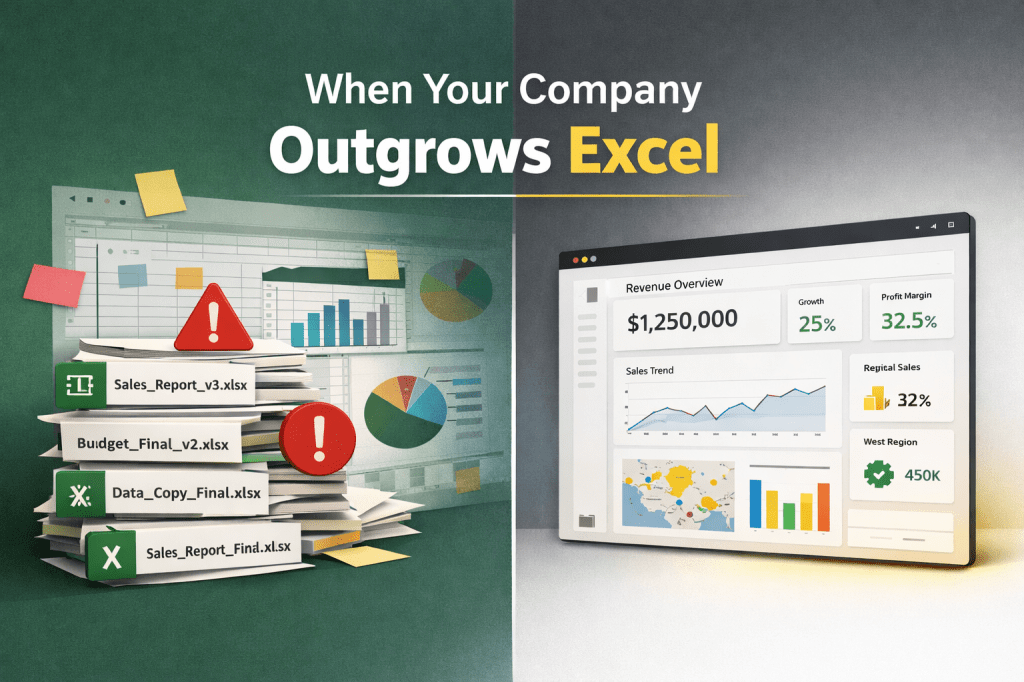
Then you see filenames like:
- Sales_Report_Final.xlsx
- Sales_Report_Final_v2.xlsx
- Sales_Report_Final_FIX.xlsx
- Sales_Report_Final_REALLY_FINAL.xlsx
It always starts like this. Always!
At this point, people stop trusting numbers.
Why? Because there are too many versions of the truth.
How Power BI fixes this?
Power BI forces one thing Excel never really enforces: one source of truth.
One dataset. One model. One definition of KPIs.
From my experience, this alone removes 50% of unnecessary discussions in meetings.
2. Reporting Becomes a Hidden Full-Time Job
Here’s something I’ve noticed so many times.
If you ask data analyst how long does reporting take per week, they’ll usually say: “Not much. A few hours”.
But then I sit next to analysts, controllers, or managers and watch what actually happens:
- Download/Export data from CRM
- Clean it manually (replace column names, remove not needed columns, unmerge cells, replace some text, remove totals…..)
- Formulas… Copy formulas from last week’s version. Drag formulas to the last row in the sheet. Yes, of course you missed a few places to drag formula to the last row.
- Formulas again. And yes, if you don’t use $ symbol in formulas to lock row/column, it takes even longer. And you easily get even more errors.
- Copy-paste conditional formatting to new rows.
- Rebuild pivots and then copy summary data to another file
- Double-check numbers
- Explain why this month looks different
- Oh, now you see that you actually exported wrong data from CRM, you didn’t include all needed filters.. OK, let’s repeat the process again!
Suddenly, it’s not hours. It’s days. Every week.
How Power BI fixes this?
Power BI removes repetition.
Once you clean and model data, it stays that way.
Reports refresh automatically.
Logic doesn’t get rewritten every day/week/month.
People finally spend time thinking instead of fixing.
Even if you don’t use Power BI, at least start using Power Query in Excel. It will save you a ton of time!
Yes, Power Query is essential part of both Excel and Power BI.
3. Excel Works Great. Until It Starts Freezing.
This one is very familiar.
Everything works fine. Then:
- The file gets slow. It takes minutes to open
- There is one table on the sheet. You try to filter data
- Excel freezes. Then crashes
- Why? Either you have hundreds thousands rows or you have a few dozen thousands rows, but you use complex formulas and lookups. Or you have a lot of synced pivot tables?
How Power BI fixes this?
Power BI is built for large datasets and multiple sources.
Millions of rows are normal thing.
Data doesn’t live on one person’s laptop. It’s web based.
Performance is predictable.
From my experience, teams immediately feel relief once they’re not afraid of opening a report.
4. KPIs Mean Different Things to Different People
Ask different people in the company:
“What is revenue?”
You’ll often get different answers.
In Excel, KPI logic lives inside formulas. Undocumented.
I’ve seen meetings where people argue for 30 minutes, not because data is wrong, but because definitions are unclear.
Wasted time.
How Power BI fixes this?
Power BI forces you to define KPIs properly.
Once.
Transparent.
Everyone looks at the same logic. No hidden cells. No mystery formulas.
Everyone looks at same KPI, same logic, same value.
Meetings become about decisions, not explanations.
5. Excel Answers – New Reports, New Mails
CEO or manager asks a question.
You build a report.
Then comes the next question:
- “Can we see this by region?”
- “What about last week/month/year?”
- “What happens if we filter by customer?”
Back to Excel. New report. New file.
I’ve seen analysts stuck in an endless loop of “just one more report”.
How Power BI fixes this?
Power BI is interactive by default.
One report answers many questions.
Users can filter, drill, explore on their own.
From my experience, this is when executives stop asking for reports and start asking better questions.
6. Excel Security Is Mostly Based on Trust
Excel security usually means:
- “Please don’t change this”
- “Only send it to these people”
- “Hide this sheet”
- “Pay attention when sending this email”
I’ve seen sensitive data sent by mistake more times than I’d like to admit.
How Power BI fixes this?
Power BI has REAL security:
- Row-level security (everyone looks at same report, but salesman for US sees only US data, salesman for Europe sees only Europe data, salesman for Asia sees only Asia data…)
- Controlled sharing – if someone get’s link to the report, but we didn’t grant permission to this person.. This person will see nothing!
Until we say, yes, this person can see report, this person will not have option to see any data. - Only data analysts have access to data model and calculations. All other users can only read data on reports, but can’t fix formulas.
Again, we define if specifics users can create reports based on our data model, or we are the only ones who are responsible for report creation - People see only what they’re supposed to see. Automatically.
No manual filtering. No hoping nothing goes wrong.
7. Data Refreshing in Excel Is Way More Fragile Than It Looks
This one hits especially hard once the company grows.
I’ve seen Excel files where refreshing data meant:
- “First open this file”
- “Then paste this export”
- “Then refresh pivots in this order”
- “But don’t touch that tab”
And of course, only one person really knows how it works.
If that person is sick, on vacation, or leaves the company… reporting stops.
I’ve seen entire management meetings delayed because “the Excel didn’t refresh properly”.
How Power BI fixes this?
Power BI treats data refresh as a system:
- Data refreshes automatically
- On a schedule
- From the original source
- With refresh history and errors visible
From my experience, this removes stress people didn’t even realize they were carrying.
Every morning, you get refresh data in report.
Pretty nice, right?
Excel Hides Problems. Power BI Exposes Them.
Everyone loves Excel because data and formulas can be changed everywhere.
But, this can also be a bad thing.
I’ve seen so many data manipulation in Excel. So many!
So, when a company starts using Power BI, there are 2 main complaints:
1) users complain they can’t export data to Excel
2) users complain they can’t change data/formulas
Now, stop. Think about it again.
Is it good or bad thing?
In Power BI, only specific people manage data model. And they control data quality.
It is centralized.
This is the reason all users see same KPI, same logic, same value.
So When Is It Time to Move On?
Not when Excel completely breaks.
But when:
- Reporting feels heavy
- Numbers are questioned more than discussed
- Files multiply
- Decisions slow down
- People depend on a few “Excel heroes”
Excel is a tool.
Power BI is a system.
From my experience, growing companies eventually need systems.
Final Thought
Most companies don’t move from Excel to Power BI because of technology.
They move because they want:
- Clarity
- Speed
- Confidence in decisions
Excel helps you start.
Power BI helps you scale.
And almost every company I’ve worked with says the same thing in the end:
“We should have done this earlier.”
