Tag: data visualization
-
Excel Didn’t Suddenly Fail You. It Just Slowly Started Hurting.
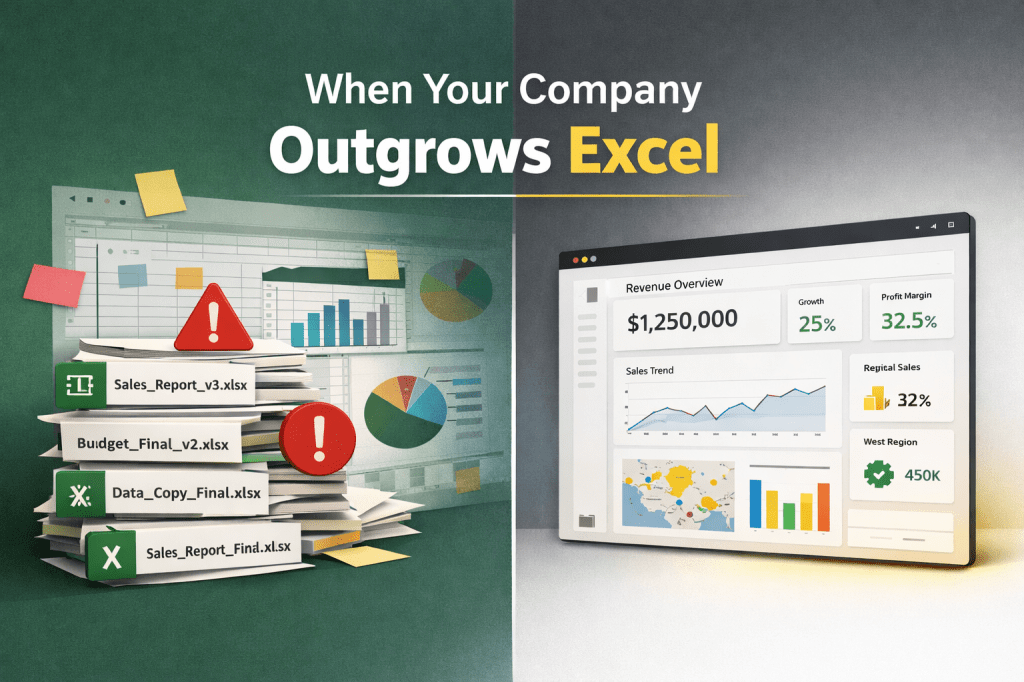
The writer totally loves Excel after using it for five years, but notes that it can become a bottleneck in growing companies. Issues pop up with version control, complex reporting, and inconsistent KPIs. Power BI fixes all this by providing a single source of truth, improving efficiency, and enhancing data security. Switching to it reduces…
-
RLS and Single-Select Slicers in Power BI: A Perfect Recipe for a BROKEN Report?

Single-select slicers in Power BI require a chosen value, which can cause issues with Row-Level Security (RLS). If default selections are not accessible, reports may appear empty. To mitigate this, adding a placeholder option can prompt users to select a value. A landing page with conditional buttons enhances user experience.
-
Boost Your Reports: Create Stunning Bar Charts using Markers and Conditional Formatting
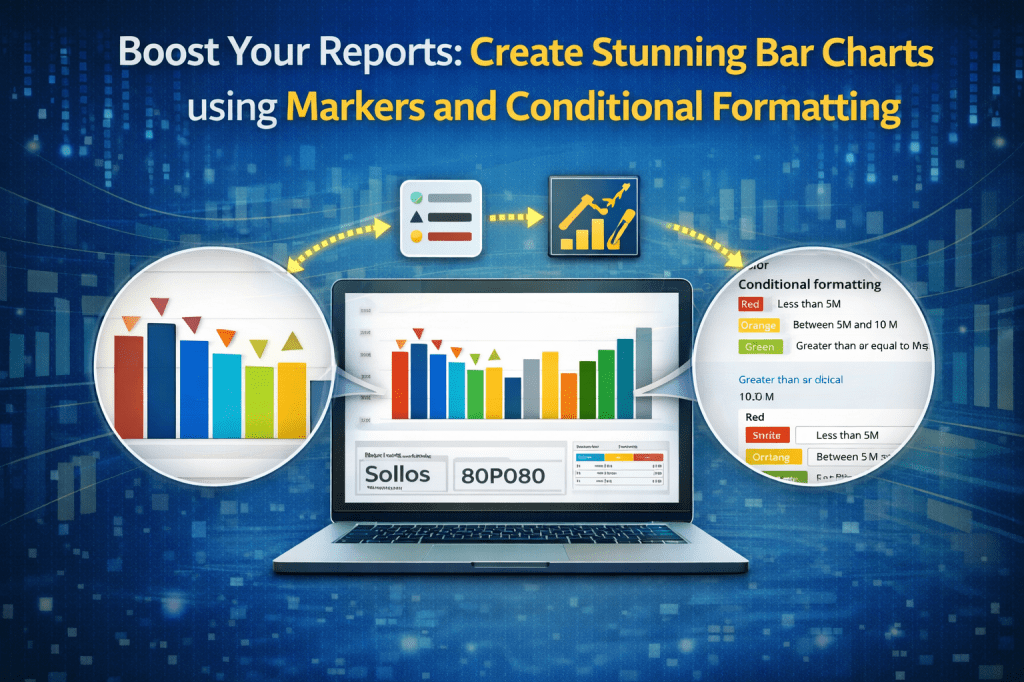
Learn how to transform your Power BI bar charts using markers and conditional formatting. This guide shows practical steps to enhance data storytelling, highlight important insights, and make your reports stand out with clear, professional visuals that impress stakeholders and improve decision-making.
-
From ~250 page objects to 6 simple table visuals in Power BI
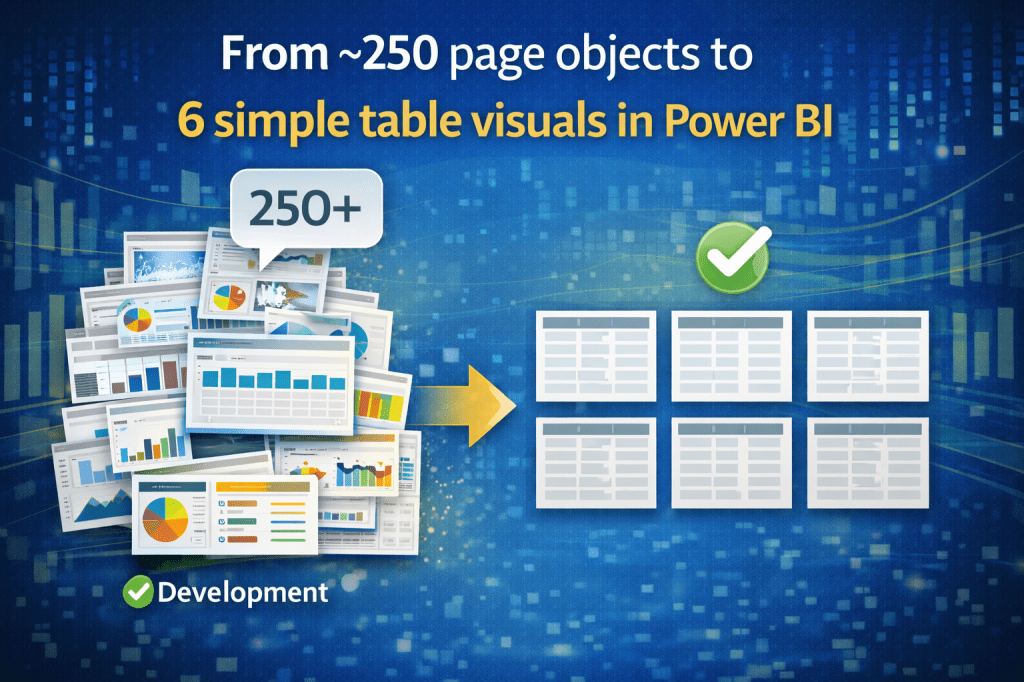
Stop using cell-based report design in Power BI. One of my latest projects included this business requirement: design a Power BI page that looked exactly like a paginated/Excel report – 6 tables, each with 3 columns. BUT, every cell having its own formatting and calculation. Sure, you could drag 250 card visuals and hope for…
