
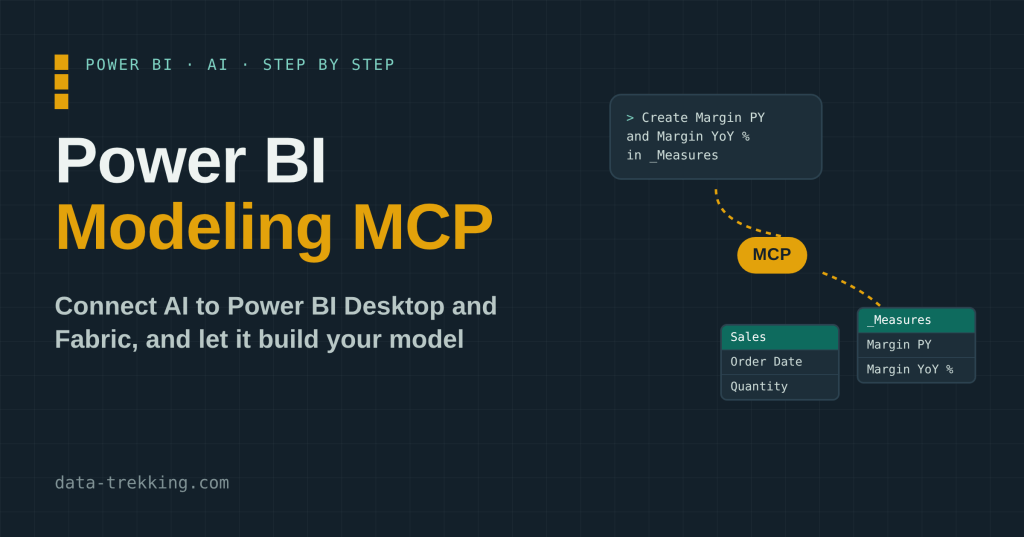
You’ve heard it so many times: “AI will build your Power BI model for you.”
Will it?
It can already do a lot. But only if you connect it the right way.
And that is exactly where people get stuck. One thread on the Fabric Community forum, “Power BI MCP Server not connecting to Power service”, has more than 13,000 views. Others ask how to make it work with Codex, Claude or a service principal.
Short answer: for Power BI Desktop and PBIP files you need the local Power BI Modeling MCP server (Microsoft now calls it the Power BI Authoring MCP server). It works over XMLA, so for models in the Power BI Service you also need Write permission and the XMLA endpoint set to Read Write. If you only want to ask questions about data, that is a different server.
In this post we will install it, connect it to a demo model and let it do three real tasks.
1. Which Power BI MCP server do you actually need?
Microsoft has more than one MCP server for Power BI. Mixing them up is mistake number one.
- Power BI Authoring MCP server – local (
@microsoft/powerbi-modeling-mcp). Generally available. Runs on your Windows machine. Reads and changes semantic models: tables, columns, measures, relationships, calculation groups, RLS roles, translations. Connects to Power BI Desktop, PBIP/TMDL folders and models in Fabric workspaces. - Power BI Authoring MCP server – hosted (
https://api.fabric.microsoft.com/v1/mcp/powerbi/authoring). Preview. Nothing to install, but it only sees models in Fabric workspaces. No Power BI Desktop, no local files. - Fabric IQ MCP. For answering business questions on top of your semantic models. It is not for editing models.
So the rule is simple:
- You want AI to build or change a model → Authoring MCP (local).
- You want AI to answer questions from a model → Fabric IQ MCP.
2. Install the local Power BI Modeling MCP server
The easiest way is VS Code:
- Install VS Code.
- Install the GitHub Copilot Chat extension and sign in with your GitHub account (there is a free Copilot plan).
- Install the Power BI Modeling MCP extension from the VS Code Marketplace. The server is included in the extension.
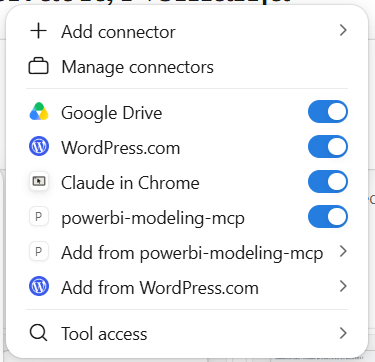
- Open Copilot Chat, switch to Agent mode, click the tools icon and check that powerbi-modeling-mcp is turned on.
That’s it.
Prefer Claude, Cursor or another AI app? It works there too. You only need to add the server in that app’s MCP settings. Microsoft’s GitHub page has the configuration.
Tip: start the server in read-only mode (the --readonly option). The AI can read your model and run DAX queries, but it can’t change anything. When you trust the setup, turn it off. Even then, the server asks you to confirm before the first change.
3. Connect to Power BI Desktop
Open your report in Power BI Desktop. In my case it is the demo file DataTrekking Demo.pbip.
Then simply write in chat:
Connect to 'DataTrekking Demo' in Power BI Desktop.List the tables and measures in this model.
Always start with a read-only question. If the answer lists your real tables, the connection works.
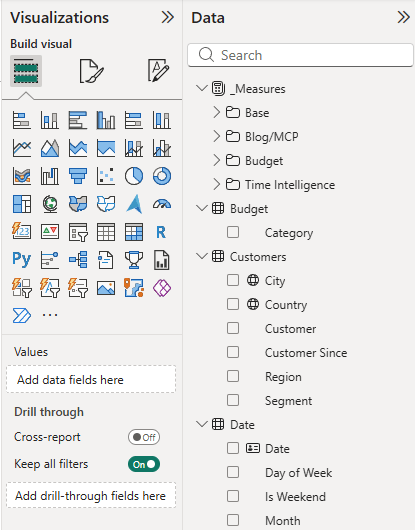
In my demo model it found 7 tables (_Measures, Sales, Budget, Customers, Products, Sales Reps, Date) and 16 measures in three display folders: Base, Time Intelligence and Budget. Correct.
4. Three real tasks on the demo model
Now let’s get practical.
Task 1: create new measures
In the _Measures table, create two measures in the display folder "Blog/MCP":Margin PY = margin for the same period last year,Margin YoY % = change of Margin vs Margin PY.Use the existing measures and format them like the other measures.
This is what it created (in a few seconds, with descriptions and formatting):
Margin PY =CALCULATE ( [Margin], SAMEPERIODLASTYEAR ( 'Date'[Date] ) )Margin YoY % =DIVIDE ( [Margin] - [Margin PY], [Margin PY] )
It reused my existing measures ([Margin]) and my date table. That is the point. The AI works with your model, not with a generic example from the internet.
Task 2: check the result with a DAX query
Never trust a new measure before you see numbers.
Run a DAX query that shows Margin, Margin PY and Margin YoY % by year.
The AI wrote and ran this query:
EVALUATESUMMARIZECOLUMNS ( 'Date'[Year], "Margin", [Margin], "Margin PY", [Margin PY], "Margin YoY %", [Margin YoY %])ORDER BY 'Date'[Year]
And here is the result:
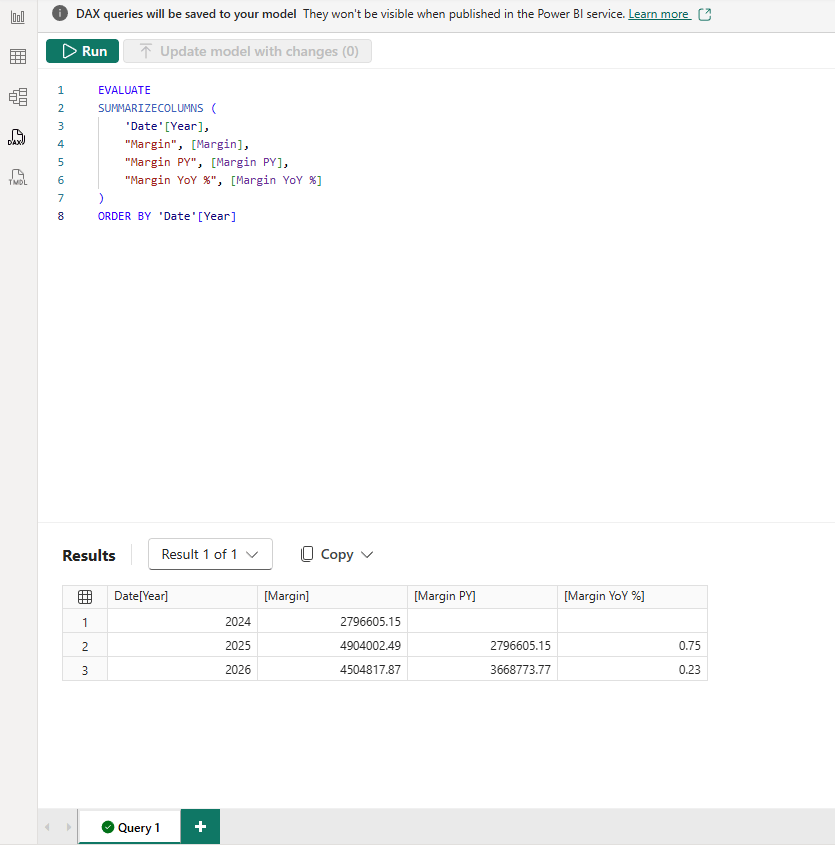
- 2024: Margin $2,796,605, no PY
- 2025: Margin $4,904,002, PY $2,796,605, +75.4%
- 2026: Margin $4,504,818, PY $4,904,002, −8.1%
Wait. −8.1% in 2026?
The demo data goes only until the end of October 2026. So we compare 10 months of 2026 with 12 months of 2025. The measure is “correct”, but the number is wrong for the business.
This is exactly the kind of thing AI will not tell you if you don’t look. So I asked:
2026 is not finished. Change Margin PY so it compares only up to the same day as the last sale.
New version:
Margin PY =VAR _LastSaleDate = CALCULATE ( MAX ( Sales[Order Date] ), REMOVEFILTERS ( 'Date' ) )RETURN CALCULATE ( [Margin], SAMEPERIODLASTYEAR ( 'Date'[Date] ), 'Date'[Date] <= EDATE ( _LastSaleDate, -12 ) )
Same query again: 2026 Margin $4,504,818 vs PY $3,668,774 = +22.8%. From “we are going down” to “we are growing”. Big difference for a management report!
Task 3: document the model
This is the boring job nobody does. Perfect job for AI.
Add a short business description to every measure in the _Measures tablethat doesn't have one. Don't change any expression.
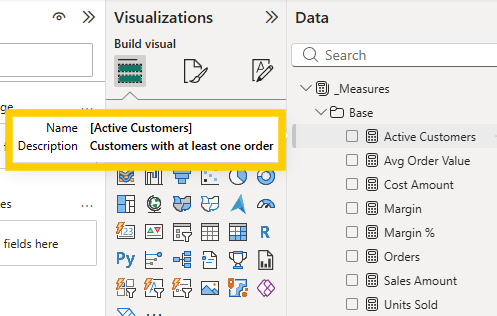
13 measures got a description, for example Avg Order Value: “Average Sales Amount per order”. No expression was touched.
Descriptions show up as tooltips in the Data pane. Your report users (and your future self) will thank you.
5. Connect to a model in the Power BI Service (Fabric)
This is where that 13K-view forum thread comes from.
To connect the local server to a published semantic model, write:
Connect to semantic model 'DataTrekking Demo' in Fabric workspace 'My Workspace Name'.
Before that, check three things:
- XMLA endpoint = Read Write on the capacity (Admin portal → Capacity settings). The server talks to the model over XMLA, like Tabular Editor.
- Write permission on the semantic model. With only Build permission it can run DAX queries, but every change will fail.
- The workspace is on a capacity (Premium, Fabric or PPU), because XMLA works only there.
The accepted answer on that thread (from almost a year ago) says the local server can’t authenticate to the Service at all. Current Microsoft documentation lists Fabric workspace models as supported, so if you hit that error, update the extension first (@latest) and then check the list above.
If you don’t want to install anything, there is also the hosted endpoint. Your Fabric admin must enable the tenant setting “Users can use the Power BI Model Context Protocol server endpoint”. Remember: it can’t see Power BI Desktop or local files.
6. Safest way to work: PBIP + Git
AI makes mistakes. Sometimes small, sometimes “where did my relationship go?”
So my workflow is:
- Save the report as PBIP (Power BI Project).
- Put the folder in Git (or at least make a copy).
- Let MCP change the model. It can even open the PBIP folder directly (example below).
- Review what changed (in Git you see every measure and every line), then open it in Power BI Desktop.
Open semantic model from PBIP folder 'C:\Projects\DataTrekking Demo\DataTrekking Demo.SemanticModel\definition'
PBIP is also the reason I could reduce a report from ~250 page objects to 6 visuals: everything is text, so you can see it and fix it.
Common mistakes
- Using the wrong server. The query-only server can’t create measures. You need the Authoring (modeling) server.
- Build instead of Write permission. Reads work, changes fail. Ask the workspace admin for Contributor or higher.
- XMLA endpoint is Read Only (or the workspace is on Pro). Desktop works, the Service doesn’t.
- Too big requests. “Fix my whole model” stalls or does strange things. Give it small steps and context.
- No backup. Start with
--readonly, then PBIP + Git.
FAQ
Is the Power BI Modeling MCP server free?
Yes. It’s an open-source tool from Microsoft (MIT license). You pay for the AI client you use (GitHub Copilot, Claude, etc.) and, for Service models, you need a capacity with XMLA.
Can it create report pages and visuals?
Not the MCP server itself. Its tools work only with the semantic model: tables, measures, relationships, security roles, translations.
But if you save your report as PBIP (with the new PBIR report format), every page and every visual is a separate JSON file. An AI agent with access to that folder can create or change pages by editing those files. Then close and reopen the file in Power BI Desktop. I used this to build report pages, and it works well, as long as you review the result before you publish.
Does it work on Mac?
The local server doesn’t. Mac users can use the hosted endpoint, but only for models in Fabric workspaces.
Is my data sent to the AI?
Model metadata and the results of DAX queries go to the AI provider of your client. For sensitive models, check this with your security team first.
So… is AI building our models now?
Not alone. It doesn’t know your business, your naming rules or what “Revenue” means in your company.
But the boring part (descriptions, translations, renaming 200 columns, checking measures) is done in minutes.
Use that time for the part AI can’t do. Be the developer who knows why the model looks like this.
This post is based on the most viewed solved questions about MCP on the Fabric Community forum and on Microsoft’s Power BI Authoring MCP documentation.